How to build a “scrollytelling” map using Mapbox and Glitch
Every step to tell a story with the new Interactive Storytelling template #
Mapbox's new Interactive Storytelling template is out and available on Glitch, ready for you to dive in creating guided narratives with a fully interactive map and little to no code. Major media outlets have used this format to tell powerful stories, like the San Francisco Chronicle's deeper look at the origin of the Kincade fire, or the Washington Post's exploration of the 1968 Riots in Washington, DC.
At its core, the template can be used as is, without ever having to style or upload any data to Mapbox Studio. All you need is a **Mapbox accoun**t, an **access toke**n, and Glitch to start building a simple but very effective "scrollytelling" story that showcases different places in a region or a timeline of events with chapters and basic markers on an animated map.
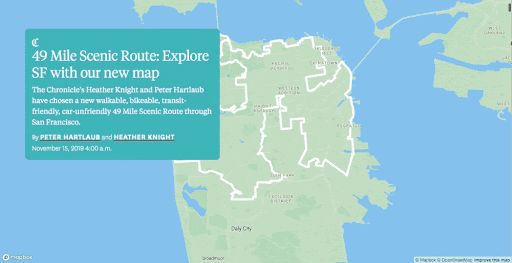
Basic map #
First, navigate to Mapbox's Glitch team page and click on our template collection. All you have to do from here is click on "remix This" on the featured template called "mapbox-storytelling-template."
This will take you to the Glitch code editor. There you will see 3 files:
- config.js: This is the file you will be working in.
- index.html: This contains the code for the template. You can open it in your browser to see your progress as you build your story.
- An asset folder for all your images and other assets.
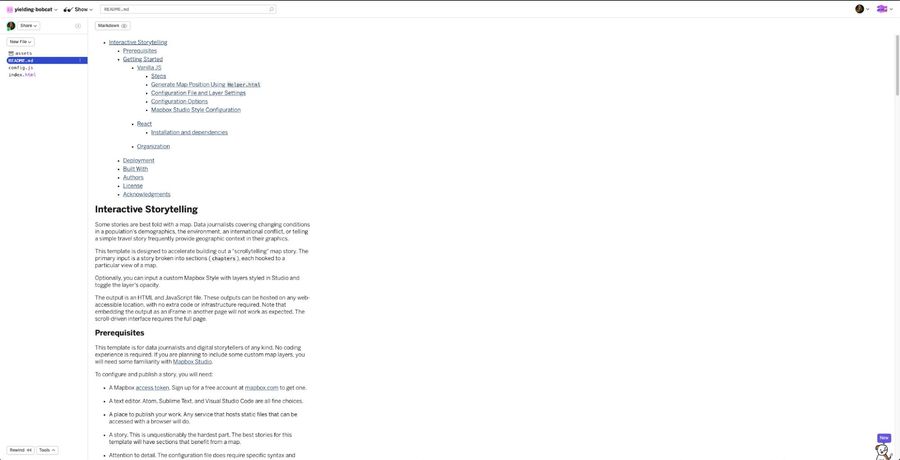
To get started, open config.js. Below is the configuration file untouched:
First, add your access token (which you can find here after creating an account.) Mapbox Streets is included in the template by default, but if you'd like to use a different base map, just swap in **the style ur**l of your choice.
We're going to the include the default markers by leaving showMarkers value to true.
Now, we're going to start filling in the location information for each chapter. You can use this tool to help you identify the coordinates (map center), zoom level, pitch, and bearing, to dial in the exact map view for each chapter. To do this, open the tool, type in an address in the geocoder in the top right corner, and move the map around to adjust the view. Control+click and tilt and rotates the map if you'd like. And don't forget to take into account the placement of the block of text in the template (default value is left-aligned). Finally, copy the location information code and paste into the configuration file.
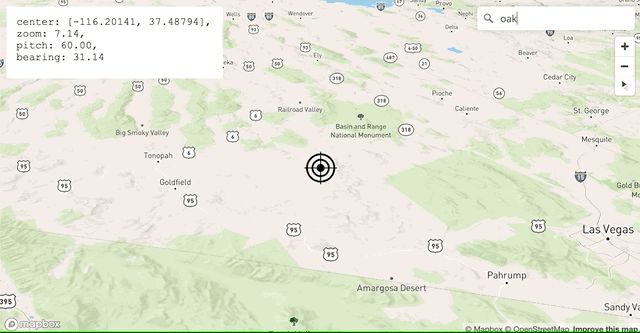
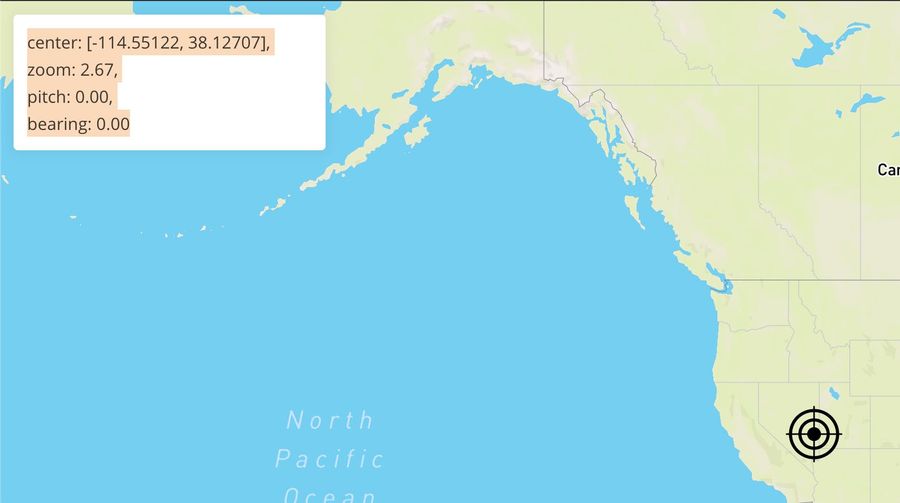
Repeat this process until you have all your locations set up. You can then start adding a title, a description, and url or paths to images.
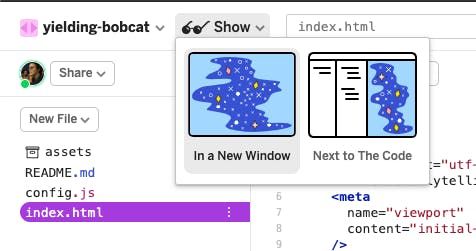
To check out the results, click on "Show" > "In a New Window" and scroll. That's it! You now have a fully functional map with markers. You can view a demo here.
Level up: Styling layers #
Now, we're going to take this template to the next level by styling custom layers in Studio and using the template to control the layers' visibility. The following example uses 2016 Presidential election data from Tony McGovern who scraped the data from Townhall.com and US Census data.
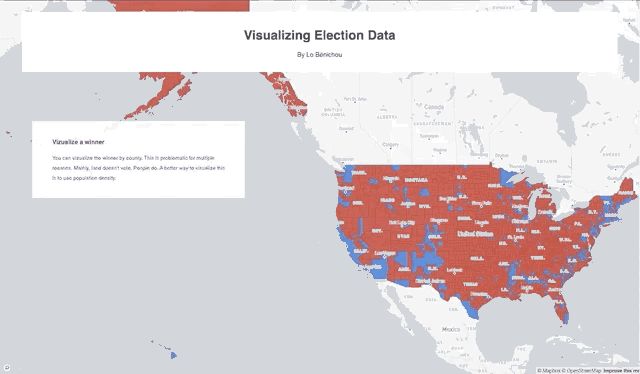
To include custom layers in your story, you first have to upload and style your data using Mapbox Studio.
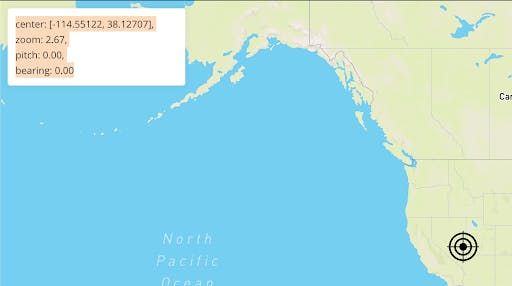
After uploading and styling your data, you should toggle the layer's opacity (NOT the visibility) based on the layer's desired behavior when scrolling. The rule of thumb is that the opacity of a layer set in Studio will remain the same until it is changed in the template configuration files.
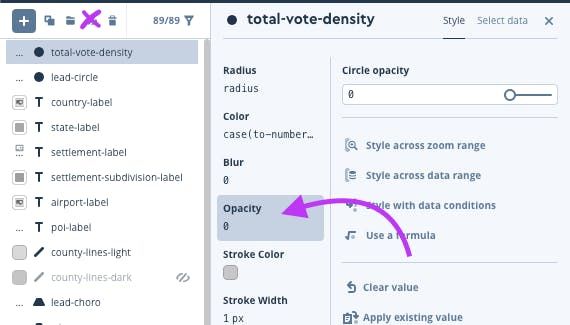
In the example above, I want all my layers to be invisible on my first chapter so I will toggle the layer opacity to 0. You can keep all the layers that won't require any adjustments, such as background, water, etc at opacity 1.
For all layers that you don't want to be visible in the first chapter, turn the opacity down. Those will be adjusted in the configuration file later. Once you're done, you can publish your style and click on the "Share" button to get the style url and your access token.
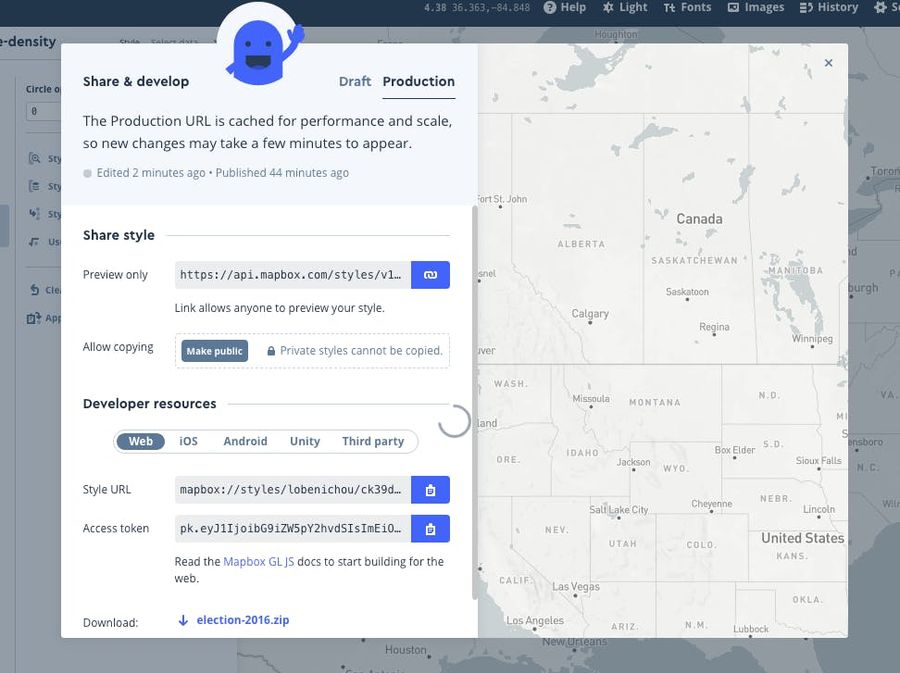
The url and the token will go at the top of your configuration file. You should also turn off the showMarkers option since we won't be needing the default markers for this story. Pick a theme (dark , light) and an alignment (left, right, center).
Now, we're going to update our chapters and adjust layers based on the story we'd like to tell.
Similar to our basic example, you can update the title, the description, and even add an image. But we're also going to specify the opacity of each layer, which will be triggered as the user scrolls through the different chapters of your story. This means that when a text block enters or exits the screen, the layers' opacity will adjust based on your settings.
Note that a chapter can enter the screen twice: once while the user scrolls down and once while the user scrolls back up. This means that if you want certain layers to return to their initial state, you will want to specify the settings in onChapterEnter.
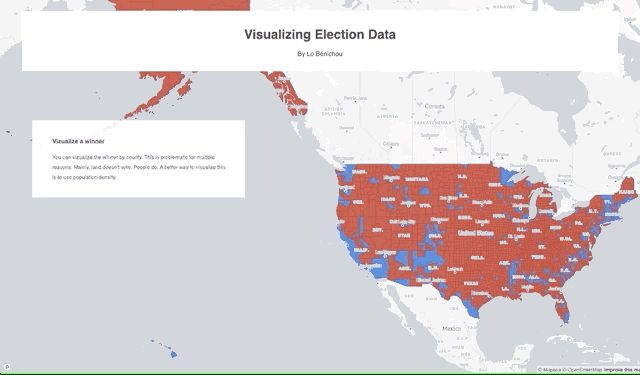
With onChapterEnter and onChapterExit you can control the opacity of each layer using a number from 0 to 1. Below, I am adjusting winnerto be 0.8 on enter and 0 on exit.
For each chapter, you can repeat those steps, adjusting your layers as needed. The result should be a story that takes the reader through relevant data points, contextualized by location and visualizations. You can experience the full demo here.
Glitch saves your code automatically so all you need to do to view your demo is to go to the url provided. With very little code, you now have a fully functioning interactive live on the web!
Share what you build on twitter with #builtwithmapbox and if you have any questions, reach out at @lobenichou.

